Bitcoin correlated Assets - Performances Analysis
and their Pros and Cons

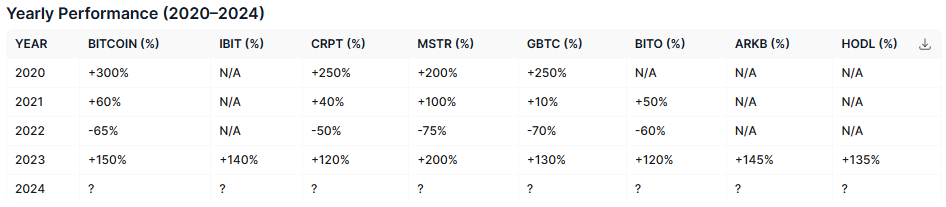
Sure DividendGuy67, here’s Bitcoin-Correlated ETFs: Performance (2020–2024)
Key Assets and Correlation with Bitcoin
BTC (Bitcoin): Correlation = 1.00
IBIT (iShares Bitcoin Trust): Correlation ~0.99
CRPT (SkyBridge Crypto ETF): Correlation ~0.85
MSTR (MicroStrategy): Correlation ~0.80
GBTC (Grayscale Bitcoin Trust): Correlation ~0.95
BITO (ProShares Bitcoin Strategy ETF): Correlation ~0.90
ARKB (ARK 21Shares Bitcoin ETF): Correlation ~0.99
HODL (VanEck Bitcoin Trust): Correlation ~0.99
Notes:
- IBIT, ARKB, HODL: Launched in late 2023/early 2024; performance closely mirrors Bitcoin.
- CRPT: SkyBridge Crypto ETF reflects a mix of Bitcoin and altcoin exposure, leading to lower returns during Bitcoin bull runs.
- MSTR: MicroStrategy stock shows leveraged exposure to Bitcoin due to its corporate structure.
- GBTC: Historically correlated with Bitcoin but often trades at a premium/discount.
- BITO: Futures-based ETF introduces roll costs and tracking error.
Analysis
1. Bitcoin (BTC)
- Purest form of exposure to Bitcoin's price movements.
- Pros: Decentralized, long-term growth potential.
- Cons: High volatility, requires self-custody or reliance on exchanges.
2. IBIT, ARKB, HODL (Physically-Backed ETFs)
- Regulated, near-perfect correlation with Bitcoin.
- Pros: Easy to trade, low tracking error.
- Cons: Management fees reduce returns.
3. CRPT (SkyBridge Crypto ETF)
- Diversified exposure to Bitcoin and altcoins.
- Pros: Potential for higher returns during altcoin rallies.
- Cons: Lower correlation with Bitcoin, increased risk from altcoin volatility.
4. MSTR (MicroStrategy)
- Leveraged exposure to Bitcoin through corporate structure.
- Pros: Upside from both Bitcoin appreciation and software business.
- Cons: Amplified downside risk due to debt and corporate risks.
5. GBTC (Grayscale Bitcoin Trust)
- Historically correlated with Bitcoin.
- Pros: First-mover advantage.
- Cons: Often trades at a premium/discount, higher fees.
6. BITO (Futures-Based ETF)
- Regulated and accessible for retail investors.
- Pros: Futures-based tracking.
- Cons: Roll costs and tracking error reduce returns.
Recommendation
1. For Maximum Growth Potential:
- Bitcoin (BTC): Best for direct exposure to Bitcoin's long-term growth.
2. For Regulated Exposure:
- IBIT (iShares Bitcoin Trust) or ARKB (ARK 21Shares Bitcoin ETF): Near-perfect correlation with Bitcoin, regulated, and easy to trade.
3. For Diversified Exposure:
- CRPT (SkyBridge Crypto ETF): Suitable for investors seeking broader crypto market exposure.
4. For Leveraged Upside:
- MSTR (MicroStrategy): Ideal for aggressive investors willing to take on additional corporate risk.
Final Takeaway
- Best Overall Option: IBIT or ARKB for regulated, low-cost, and highly correlated exposure to Bitcoin.
- Alternative for Diversification: CRPT if you're comfortable with broader crypto market exposure.
- Alternative for Aggressive Investors: MSTR for leveraged Bitcoin exposure.
IBIT (iShares Bitcoin Trust)
Issuer: BlackRock (the world's largest asset manager).
Structure: Physically-backed Bitcoin ETF.
Expense Ratio: 0.25% (low cost).
Objective: Provides direct exposure to Bitcoin with minimal tracking error.
ARKB (ARK 21Shares Bitcoin ETF)
Issuer: ARK Invest (led by Cathie Wood) in partnership with 21Shares .
Structure: Physically-backed Bitcoin ETF.
Expense Ratio: 0.95% (higher cost).
Objective: Tracks Bitcoin while aligning with ARK's focus on disruptive innovation.
CRPT (SkyBridge Crypto ETF)
Issuer: SkyBridge Capital .
Structure: Diversified crypto ETF (not purely Bitcoin-focused).
Expense Ratio: Varies (likely higher due to diversified holdings).
Objective: Provides exposure to Bitcoin and other cryptocurrencies, as well as blockchain-related investments.
Hi Andr,
For MSTR, your yearly returns looks wrong during BSE (Bitcoin Standard Era) - when they adopted Bitcoin, their price is around $6-$10. Today, they are $330 say 330/8 ~ 40 bagger or 4000%. That is far larger than +200% +100% -75% +200% over 4 years.
I think your source data may be wrong, or too mechanical where you combine heterogeneous data that offset one another. You should use price charts instead.